Es gibt Rituale, die wiederholen sich jedes Jahr. Kaum gibt es die ersten nennenswerten Waldbrände meldet sich eine ganz bestimmte Fraktion. Es sind diejenigen, die stets aufs Neue dann zwei Dinge behaupten:
1. Es war noch nie so schlimm
2. Die Waldbrände sind direkt dem Klimawandel zuzuschreiben
Wie gut, dass es jedes Jahr, wenn auch mit einer Verzögerung von 6 Monaten, die offizielle Waldbrandstatistik gibt. Sie bestätigt die Aussage Nummer 1 nicht. Nach den Jahren 2018 und 2019 ging es bereits in 2020 deutlich zurück mit der verbrannten Fläche. In 2021 dann noch einmal ein starker Rückgang (60%!) bei der Anzahl der Brände und der verbrannten Fläche.
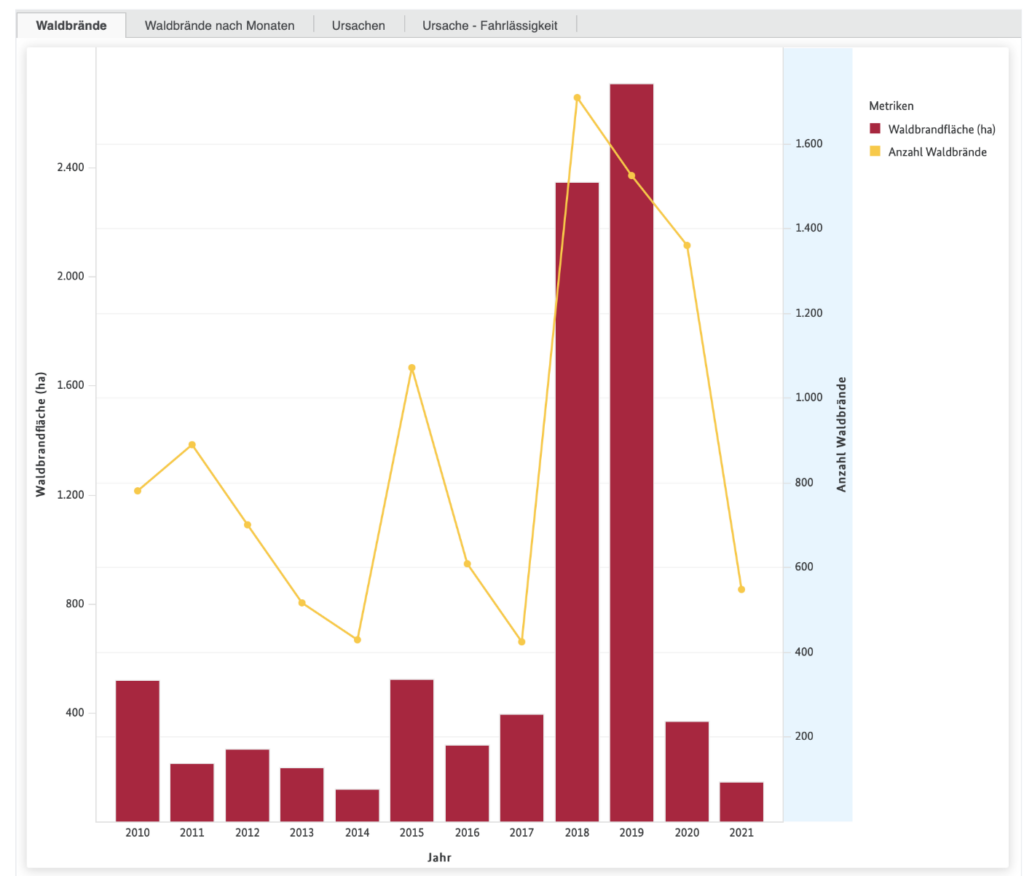
(Abbildung: Screenshot https://www.bmel-statistik.de/forst-holz/waldbrandstatistik/)
Wir haben das Thema Waldbrand schon häufiger thematisiert und versucht mit einigen Mythen aufzuräumen. Zu den Mythen gehört die Erzählung, dass bereits große Hitze zu Waldbränden führt. Das ist falsch, es ist die Trockenheit, die Brände fördert. Mythos Nummer 2 ist somit auch obsolet. Es ist der Mensch, der (wo man es weiß) für Waldbrände verantwortlich ist, egal, ob vorsätzlich oder fahrlässig. Natürliche Brandursachen wie Blitzeinschlag sind in der Statistik kaum zu finden. Der Mensch war auch der Hauptfaktor in den starken Waldbrandjahren 2018 und 2019. Aktuell gibt es eine Meldung bei RBB, die genau das bestätigt. Es geht um ein Feuer beim Ort Mühlberg.
“Den unbekannten Tätern werde laut Schmidt vorgeworfen, am Nachmittag des 23. Juni an mehreren Stellen im Landschaftsschutzgebiet Gohrischheide (Landkreis Meißen) Heide- und Forstflächen angezündet zu haben. Außerdem sollen sie noch während der Löscharbeiten am Abend des 25. Juni weitere Brände gelegt haben. Das Feuer sei in Sachsen ausgebrochen und habe auf Brandenburg übergegriffen. Den Schaden bezifferte Schmidt auf etwa 13,5 Millionen Euro.
Wegen der extremen Trockenheit und des dichten Bewuchses habe sich das Feuer schnell auf einer Fläche von mindestens 900 Hektar in Sachsen und Brandenburg ausgebreitet. Das Großfeuer war erst am vergangenen Montag unter Kontrolle, am Donnerstag konnte es vollständig gelöscht werden.”
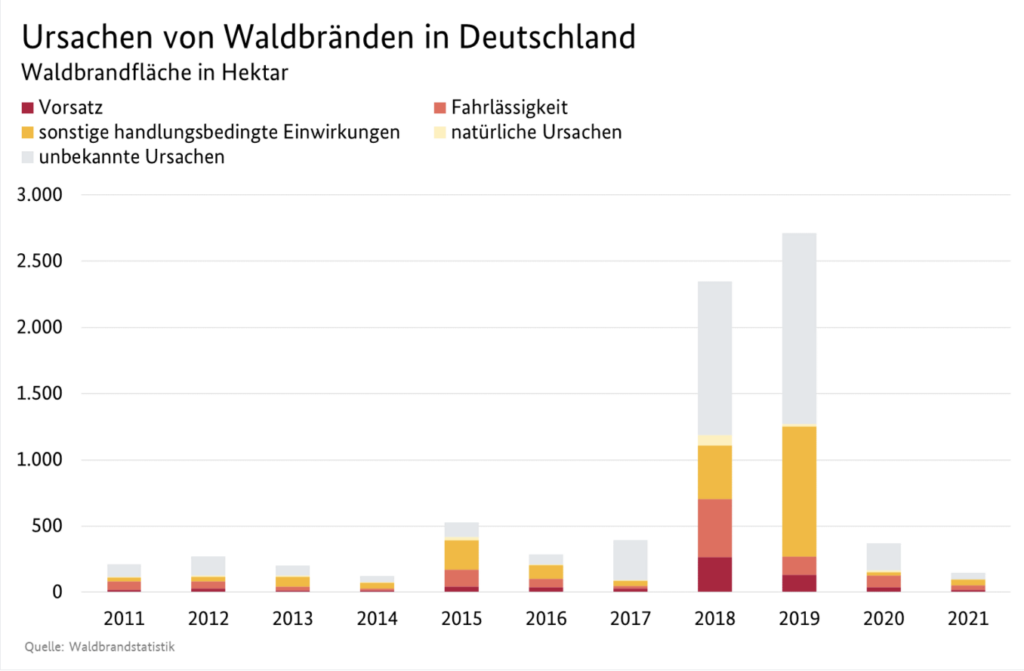
(Abbildung: Screenshot https://www.bmel-statistik.de/forst-holz/waldbrandstatistik/)
Die Zahlen räumen auch mit einem weiteren Mythos auf. Die Monate mit den häufigsten Waldbränden sind nicht zwangsläufig nur die Sommermonate. Der April ragt im Jahr 2021 heraus, während die Sommermonate Juli und August abfielen. Das ist durchaus nachvollziehbar, denn im Frühjahr kann Trockenheit zusammen mit noch nicht stattgefundener Begrünung von Bäumen und Büschen eine leider sehr gute Grundlage für Feuer geben.
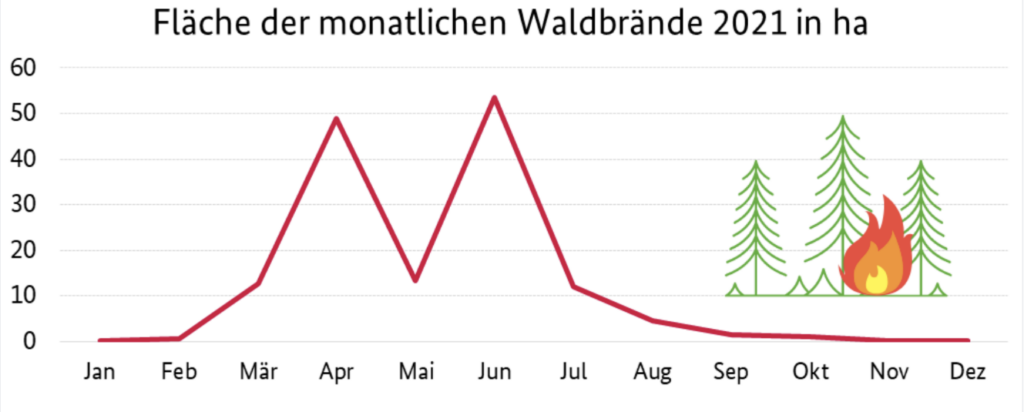
(Abbildung: Screenshot https://www.bmel-statistik.de/forst-holz/waldbrandstatistik/)
Bei den Bundesländern, in denen es im letzten Jahr am häufigsten Brände gab, hat erneut Brandenburg die Spitzenposition. Das ist aus mehreren Gründen erklärlich. In dem Bundesland dominieren Nadelwälder, in denen sich Brände gut verbreiten. Beim Ausmaß der Flächen, die verbrannt sind, kommt das Thema ehemaliger Truppenübungsplätze dazu. Davon hat Brandenburg einige. Diese Gebiete lassen sich schwer löschen, weil Feuerwehrleute das wegen der Munitionsreste nur unter erschwerten Bedingungen machen können. Es bleibt also wie es ist. Wenn es das nächste Mal wieder ”Feueralarm” von bekannten Protagonisten der “Alles wird immer schlimmer”-Fraktion gibt, dann erinnern wir uns einfach an die offiziellen Zahlen.
Wir bleiben thematisch bei Alarm. Die These, dass der Klimawandel auch zu mehr Wirbelstürmen führt, stellen neue Forschungsergebnisse in Frage. Das berichtet der MDR.
“Das könnte – so die These des Forscherteams – auch daran liegen, dass der Klimawandel die thermodynamischen Bedingungen so verändert, dass ein für Wirbelstürme feindliches Klima entsteht und deshalb sogar der Auslöser für den Rückgang der Stürme ist. In den vergangenen Jahren ist klar feststellbar, dass die Anzahl solcher gefährlichen Wirbelstürme zunimmt und dass sie mittlerweile auch Gebiete treffen, die bislang nicht als Risikogebiete galten. Nimmt man allerdings darüber hinaus einen sehr viel größeren Zeitraum über die vergangenen Jahrhunderte in den Blick, zeigt sich – zumindest in der aktuellen Studie – ein gegenteiliger Effekt. Im Vergleich zum Zeitraum von 1850 bis 1900 zeigt sich im zwanzigsten Jahrhundert, dass tropische Wirbelstürme um 13 Prozent seltener geworden sind.”
Sollte sich diese These verfestigen, dann würde eine
beliebte Erzählung in den Medien wegfallen.
Oder anders gesagt: Science is not settled. Das wird Wissenschaft allerdings
auch nie. Dass eine ehemalige Umweltministerin das tatsächlich einmal ”Science
is settled” gesagt hat, ist sowieso ein Treppenwitz und zeigt ein grundlegendes
Unverständnis von Wissenschaft. Kein Wunder, dass die Frau ins Abklingbecken
Entwicklungshilfe-Ministerium versetzt wurde.
+++
Can nuclear power secure a path to net zero?
What’s holding up the UK government’s strategy for securing the country’s energy supply in light of the Russia-Ukraine war and soaring market prices of oil and gas? According to The Guardian, a split between the prime minister, Boris Johnson, and chancellor of the exchequer, Rishi Sunak, over proposals for new nuclear reactors.
Johnson has told industry figures that he wants nuclear power to meet 25% of the UK’s energy demand by 2050, up from 16% today. That would mean roughly 30 gigawatts (GW) from a source that is currently set to shrink to 3.6GW by 2030, as all but one of the UK’s eight plants are due to be decommissioned by the end of the decade.
Weiterlesen bei The Conversation:
+++
ENSO’s Response to Volcanism in a Data Assimilation-Based Paleoclimate Reconstruction Over the Common Era
The tropical response to explosive volcanism remains underconstrained in the paleoclimate record. While the atmosphere cools due to aerosol forcing following volcanic eruptions, modeling evidence suggests that the tropical Pacific responds with compensatory warming. Given the rarity of large volcanic eruptions and the short instrumental record, these modeling results require independent verification. Here, we test for links between volcanism and tropical Pacific dynamics using the newly developed Paleo Hydrodynamics Data Assimilation product (PHYDA), which spans the past 2,000 years. Using Pacific sea surface temperature fields from PHYDA and coincident volcanic eruptions, we test the response of the El Niño–Southern Oscillation (ENSO) to large, tropical volcanic eruptions. We identify a weak El Niño-like response of the tropical Pacific in the year following sufficiently large, tropical volcanic eruptions. While the response is not significant at the 95% confidence level using superposed epoch analysis (SEA) and self-organizing maps, a significant result does emerge when employing probability density functions. Our results indicate that the widely used SEA approach, based on composite averaging, may not be sufficiently sensitive to capture an ENSO response in the presence of large internal variability. We additionally conclude that inconsistencies in both the spatial patterns and magnitudes between climate models and PHYDA results indicate that current models overestimate the regional tropical response to volcanic forcing.
+++
China trifft Maßnahmen gegen Blackouts:
World’s Largest Back-to-back Flexible DC Project Built in Greater Bay Area
+++
How Pacific decadal oscillation modulates the El Niño-related eastward transport anomaly
The equatorial intermediate currents (EICs) contribute to global circulation, climate variability, and distributions of heat, water mass, and biogeochemical quantities.
The EICs in the western Pacific show a significant interannual response to El Niño-Southern Oscillation (ENSO) at a 10- to 12-month lag, with an eastward transport anomaly (Tra) during the El Niño events.
A research team led by Prof. Wang Fan from the Institute of Oceanology of the Chinese Academy of Sciences (IOCAS) has documented the intraseasonal, seasonal, and interannual variability of the EICs in the western Pacific, and revealed that the El Niño-related eastward Tra can be modulated by the Pacific Decadal Oscillation (PDO).
The study was published in Geophysical Research Letters on March 22.
Based on the results from two long-record reanalysis products, the researchers ascertained that the PDO modulation effects were embodied in two aspects. The magnitude of the maximum eastward Tra during the warm PDO-El Niño was nearly twice as large as that during the cold PDO-El Niño, and the occurrence time of the largest eastward Tra for warm PDO-El Niño leaded that for cold PDO-El Niño by about two months.
The researchers further performed model experiments to explore the underlying mechanism. The above modulation was closely related to the wind forcing in the equatorial central Pacific. In the warm PDO phase, the enhanced and eastward-displaced anomalous westerly winds could induce the Kelvin waves with an intensified amplitude and eastward shift. These eastward propagating waves were reflected into Rossby waves at the Pacific eastern boundary. The westward and downward propagation of such Rossby waves induced the larger and earlier peaked eastward Tra.
„This study interconnects the PDO with the EICs, and expands the knowledge of intermediate current variability to an interdecadal timescale. Such variability has potential consequences for long-term inter-basin exchanges of mass, heat, and biogeochemical properties,“ said Prof. Wang.
Paper: Qiang Ma et al, Interdecadal Modulation of ENSO‐Related Anomalous Equatorial Intermediate Currents in the Western Pacific by the PDO, Geophysical Research Letters (2022). DOI: 10.1029/2022GL098409