Neue Studie dokumentiert bedeutenden Zusammenhang zwischen Sonnenaktivität und Temperaturen in Grönland

Die American Geophysical Union (AGU) gab kürzlich eine Pressemitteilung zu einer neuen interessanten Studie von Kobashi und Kollegen heraus, die sich mit den Auswirkungen solarer Aktivitätsschwankungen auf das Klima beschäftigt. Die Untersuchung fand, dass die Temperaturen in Grönland im Jahrzehnt-Maßstab signifikant von der Sonnenaktivität beeinflusst werden. Aufgrund von Ozeanzirkulationseffekten führt hier eine starke Sonnenaktivität zu einer lokalen Abkühlung. Dabei entdeckten die Forscher klimatische Verzögerungseffekte von 10-40 Jahren, die es dauerte, bis sich das solare Auslösersignal im trägen Klimasystem auswirkte. Bereits 2013 berichteten wir an dieser Stelle über eine Vorgängerarbeit derselben Arbeitsgruppe (siehe unseren Blogartikel „Grönlandische Temperaturen von Sonnenaktivität beeinflusst: Je stärker die Sonne, desto kälter war es in Grönland„).

Im folgenden die Pressemitteilung der AGU vom 16. Juli 2015 zur neuen Studie:

——————–

Sun’s activity controls Greenland temperatures

The sun’s activity could be affecting a key ocean circulation mechanism that plays an important role in regulating Greenland’s climate, according to a new study. The phenomenon could be partially responsible for cool temperatures the island experienced in the late 20th century and potentially lead to increased melting of the Greenland ice sheet in the coming decades, the new research suggests. Scientists have sought to understand why Greenland cooled during the 1970s through the early 1990s while most of the Northern Hemisphere experienced rising temperatures as a result of greenhouse warming.

The new study suggests high solar activity starting in the 1950s and continuing through the 1980s played a role in slowing down ocean circulation between the South Atlantic and the North Atlantic oceans. Combined with an influx of fresh water from melting glaciers, this slow-down halted warm water and air from reaching Greenland and cooled the island while temperatures rose across the rest of the Northern Hemisphere, according to the new study accepted for publication in Geophysical Research Letters, a journal of the American Geophysical Union. The new research also suggests weak solar activity, like the sun is currently experiencing, could slowly fire up the ocean circulation mechanism, increasing the amount of warm water and air flowing to Greenland.

Starting around 2025, temperatures in Greenland could increase more than anticipated and the island’s ice sheet could melt faster than projected, according to Takuro Kobashi, a climate scientist with the Department of Climate and Environmental Physics at the University of Bern in Switzerland and lead author of the new study. This unexpected ice loss would compound projected sea-level rise expected to occur as a result of climate change, Kobashi said. The melting Greenland ice sheet accounted for one-third of the 3.2 millimeters (0.13 inches) rise in global sea level every year from 1992 to 2011. “We need to really consider how solar activity will change in the future,” said Kobashi. “If solar activity becomes really low, as scientists expect, the Greenland ice sheet will melt faster than we expected from the climate model with just greenhouse gas [warming].”

The new study compared past solar activity with historical temperature records to figure out if the cooling Greenland experienced during the late 20th century was part of a long-term pattern.The authors of a new paper placed ice from subsections of Greenland ice cores in glass flasks. Under a vacuum, the ice melted, releasing the air trapped within the ice. The scientists used the trapped air to calculate the island’s temperatures for the past 2,100 years and compare them to vacillations in solar activity.

The team used ice cores drilled from the Greenland ice sheet to reconstruct snow temperatures for the past 2,100 years. A relatively new technique, which measures argon and nitrogen gases trapped in the ice, allowed the scientists to measure small changes in temperature at 10- to 20-year increments. The ice cores showed that for the past 2,000 years changes in Greenland temperatures have generally followed any temperature shifts occurring in the Northern Hemisphere. The new research found that the change in Greenland temperatures vacillated up and down around the average change in Northern Hemisphere temperatures over time. The vacillations coincided with changes in the sun’s energy output that occurred over multiple decades, according to the new study.

When the sun’s energy output increased, there was a bigger drop in Greenland’s temperature compared to the change in average temperature across the Northern Hemisphere. When the sun’s energy output decreased, there was a larger increase in Greenland’s temperature compared to the change in average temperature that occurred across the Northern Hemisphere. Climate models showed that changes in solar activity could prompt shifts in ocean and air circulation in the North Atlantic that affect Greenland’s climate, according to the new study.

Shifting circulation patterns

Water circulation in the Atlantic follows a steady pattern of movement, called the Atlantic Meridional Overturning Circulation (AMOC). Warm water flows from the South Atlantic toward the North Atlantic, transferring heat toward Greenland. As the water cools, it sinks to the ocean floor and travels south toward the tropics, completing the circular pattern. During a period of high solar activity, more energy from the sun reaches Earth and is transferred to tropical waters. When this warmer-than-usual water reaches the North Atlantic, it is not dense enough to sink. With nowhere to go, the water causes a traffic jam and the water circulation pattern slows down. Changes in solar activity can also alter the atmospheric circulation pattern over the Atlantic, which in turn affects ocean circulation, but how this process works is still unknown, said Kobashi.

In the late 20th century, there also was a compounding problem. Large amounts of freshwater gushed into the North Atlantic as climate change caused increased melting of glaciers, icebergs, and the Greenland ice sheet. Freshwater, being more buoyant than salt water, entered the intersection where cool water drops to the ocean floor and travels south to the tropics. Climate models showed that the water in the intersection became less salty and less likely to sink. Models also showed that additional freshwater came from an increase in rainfall, according to the new study. The traffic jam worsened and the water circulation pattern that transfers heat from the South Atlantic to the North Atlantic slowed. This slow-down caused the air above Greenland to cool and temperatures there to drop, according to the new study.

Because the oceans take a long time to heat up or cool down, the temperature changes in Greenland lagged 10 to 40 years behind the high solar activity, showing up from the 1970s through the early 1990s, according to the new study. The new study suggests low solar activity could have the opposite effect and lead to warmer temperatures in Greenland in another decade. When there is less solar energy reaching the Earth, water reaching Greenland easily sinks and returns to the tropics along the ocean floor. The water circulation pattern speeds up, quickly funneling heat toward Greenland and warming the island.

Greenhouse gases versus solar activity

The new study makes a good case that the solar maximum in the 1950s through the 1980s may have played a role in the cooling Greenland saw in the late 20th century, said Michael Mann, a climate  scientist with the Department of Meteorology at Penn State University in University Park, Pennsylvania, who was not involved in the new study. Another recent study by Mann and his colleagues proposed that trapped greenhouse gases from fossil fuel burning caused warming across the Northern Hemisphere and triggered an increase in ice melt. This led to the slowdown in ocean circulation and a cooler Greenland.

Both studies suggest buoyant meltwater from melting glaciers would have interrupted the sinking of the AMOC and its return to the tropics along the bottom of the ocean. But the new research suggests solar activity is the main driver behind the changes to the ocean circulation pattern. “I’m open-minded that the real answer is more complicated, and it may be a combination of the two hypotheses,” said Mann. “This article paves the way for a more in-depth look at what is going on. The challenge now will be teasing apart the two effects and trying to assess the relative importance of both of them.” Kobashi contends that solar activity explains the change in ocean circulation and Greenland warming since 1995, which he says cannot be explained by increasing greenhouse gases alone.

————–

Hier der Abstract der beprochenen Arbeit von Kobashi et al., die im Juli 2015 in den Geophysical Research Letters erschien:
weiter lesen

Teilen:

Sonne macht Klima: Neues aus Indien

Im September 2014 erschien im Fachblatt Palaeo3 unbemerkt von der ansonsten so klimainteressierten Presse ein wichtiges Paper einer Forschergruppe um Philip Menzel von der Universität Hamburg. Eine Pressemitteilung hierzu gab die Universität leider nicht heraus. Und auch die ebenfalls beteiligten deutschen Institute, darunter das Geoforschungszentrum Potsdam und das Senckenberg Institut schwiegen beredt. Dies ist umso bedauerlicher, da die Wissenschaftler um Philip Menzel spannende neue Erkenntnisse gewonnen hatten, die einen lang gehegten Verdacht bestätigten: Sonnenaktivitätsschwankungen spielen in der Klimahistorie der letzten 10.000 Jahre eine bedeutende Rolle.

In der Studie rekonstruierten die Forscher anhand eines Seesedimentbohrkerns das Monsungeschehen in Zentral-Indien für die vergangenen 11.000 Jahre. Dabei fanden Menzel und Kollegen eine starke Variabilität mit einem Wechsel von feuchten und trockenen Phasen. Die Dürrezeiten ereigneten sich dabei während solarer Schwächephasen. Wenn dann die Sonne wieder aufdrehte, kam auch der Regen zurück. Interessanterweise weist diese Niederschlagszyklik ein hohes Maß an Synchronität mit Temperatur-Zyklen im Nordatlantik auf, den sogenannten Bond-Zyklen, die laut Bond et al. 2001 ebenfalls einen solaren Ursprung haben. Kältephasen im Nordatlantik korrespondieren hierbei mit Dürrezeiten in Zentral-Indien. Diese sogenannte Millenniumszyklik ist aus zahlreichen Studien aus der ganzen Welt beschrieben (siehe Details in unserem Buch „Die kalte Sonne“). Die neue Studie bringt ein weiteres wichtiges Mosaiksteinchen in das wissenschaftliche Bild, in dessen Kontext auch die klimatische Millenniumszyklik der letzten 1000 Jahre mit Mittelalterlicher Wärmeperiode, Kleiner Eiszeit und Moderner Wärmephase zu sehen ist.

Im Folgenden die Zusammenfassung der Arbeit von Menzel und Kollegen:

Linking Holocene drying trends from Lonar Lake in monsoonal central India to North Atlantic cooling events
We present the results of biogeochemical and mineralogical analyses on a sediment core that covers the Holocene sedimentation history of the climatically sensitive, closed, saline, and alkaline Lonar Lake in the core monsoon zone in central India. We compare our results of C/N ratios, stable carbon and nitrogen isotopes, grain-size, as well as amino acid derived degradation proxies with climatically sensitive proxies of other records from South Asia and the North Atlantic region. The comparison reveals some more or less contemporaneous climate shifts. At Lonar Lake, a general long term climate transition from wet conditions during the early Holocene to drier conditions during the late Holocene, delineating the insolation curve, can be reconstructed. In addition to the previously identified periods of prolonged drought during 4.6–3.9 and 2.0–0.6 cal ka that have been attributed to temperature changes in the Indo Pacific Warm Pool, several additional phases of shorter term climate alteration superimposed upon the general climate trend can be identified. These correlate with cold phases in the North Atlantic region. The most pronounced climate deteriorations indicated by our data occurred during 6.2–5.2, 4.6–3.9, and 2.0–0.6 cal ka BP. The strong dry phase between 4.6 and 3.9 cal ka BP at Lonar Lake corroborates the hypothesis that severe climate deterioration contributed to the decline of the Indus Civilisation about 3.9 ka BP.

In den Highlights zum Paper schreiben die Autoren:

Changes in solar activity seem to cause the centennial climate shifts.

In den Conclusions gehen die Autoren etwas genauer auf die Zyklik und den nordatlantischen Vergleich ein:

The long term climate trend is superimposed by several shorter term climate fluctuations. Some of these fluctuations have also been observed in other high resolution climate records from Asia, and they can be correlated with the North Atlantic Bond events (Bond et al., 2001; Bond et al., 1997). The correlation is the same as observed for the long term trend with cold periods in the North Atlantic correlating with dry periods over South Asia and vice versa. All the 9 Bond events during the Holocene are isochronally (within dating uncertainties) reflected in the Lonar Lake record. This points to a connection between the two climate systems or to an identical trigger of climate variability. The fact that the Bioclastic Climate Index (BCI) quite well delineates the solar output proxy 14C production rate (Bond et al., 2001) corroborates the assumption that variations in solar activity triggered centennial scale variability of the Indian monsoon climate during the Holocene.

Einige Monate später, im April 2015, bestätigte eine Forschergruppe um Hai Xu im Fachblatt The Holocene das generelle Ergebnis: Der wiederholte Ausfall des Indischen Sommermonsuns während der letzten 10.000 Jahre geht hauptsächlich auf Schwankungen in der Sonnenaktivität zurück:

Abrupt Holocene Indian Summer Monsoon failures: A primary response to solar activity?
Knowledge of the millennial abrupt monsoon failures is critical to understanding the related causes. Here, we extracted proxy indices of Indian Summer Monsoon (ISM) intensity during the early to mid-Holocene, from peat deposits at Lake Xihu, in southwestern China. There are a series of abrupt, millennial-scale episodes of ISM weakening inferred from the Lake Xihu records, which are generally synchronous with those inferred from other archives over ISM areas. An important feature is that the ISM failures inferred from the Lake Xihu proxy indices synchronize well with abrupt changes in solar activity. We argue that changes in solar activity play a primary role in producing most of these millennial ISM failures, while some other causes, including freshwater outbursts into the North Atlantic Ocean and changes in sea surface temperatures of the eastern tropical Pacific Ocean, may have also exerted influences on parts of the millennial ISM failures.

Einen Sonnenbezug des Indischen Monsuns fanden auch Hiremath und Kollegen, nachzulesen in der Februar 2015-Ausgabe des Fachblatts New Astronomy:

weiter lesen

Teilen:

Sonne macht Klima: Neues aus China

Schwankungen der Sonnenaktivität stellen einen bedeutenden Klimafaktor in China dar wie eine Vielzahl von Studien zeigt. Dies gilt auch für Tibet. Im November 2013 publizierte eine Forschergruppe um Yuxin He in den Quaternary Science Reviews eine Untersuchung zur Klimageschichte der letzten zweieinhalb Jahrtausende auf dem nördlichen Tibetplateau. He und Kollegen fanden starke natürliche Schwankungen, die gut mit der solaren Aktivitätsentwicklung korrelierten. Hier der Abstract:

Late Holocene coupled moisture and temperature changes on the northern Tibetan Plateau
The northern Tibetan Plateau involves complex interactions between the mid-latitude westerly circulation and the subtropical Asia monsoon circulation, acting as a bridge communicating high and low latitude climatic processes. Previous studies from the region suggest relatively wet conditions in cold periods during the late Holocene, for instance, the Little Ice Age (LIA). However, the inference of such temperature-moisture association is subject to the large uncertainty in lacustrine 14C chronology, due to the particularly large lake reservoir effect in the region. Here we take a different approach by reconstructing paired temperature and moisture records from the same sediment cores to assess the temperature-moisture association, independent of chronology uncertainty. We use alkenone indices UK′37 and %C37:4 to reconstruct high resolution temperature and moisture changes simultaneously from two lakes in the Qaidam Basin, northern Tibetan Plateau, over the last 2500 years. Characterized by marked climatic variability, our paired records confirm the warm-dry and cold-wet association in arid northwestern China during the late Holocene, opposite to the warm–wet and cold–dry association in subtropical Asian monsoonal regions. Our moisture records further suggest substantially drier conditions during the Medieval Warm Period (MWP) than the current warm period. Lastly, the temperature and moisture changes inferred from our records can be well correlated with solar irradiance changes, suggesting a possible link between solar forcing and natural climate variability during the late Holocene on the northern Tibetan Plateau.

Im April 2014 fügte ein Wissenschaftlerteam um Hai Xu eine weitere Studie zum Tibetplateau hinzu, die in den Quaternary Science Reviews erschien. Mithilfe von Isotopenuntersuchungen an Muschelkrebsschalen rekonstruierten die Forscher die Temperaturgeschichte und fanden erneut einen starken Bezug zu Sonnenaktivitätsschwankungen. Hier die Kurzfassung:

Decadal/multi-decadal temperature discrepancies along the eastern margin of the Tibetan Plateau
Knowledge of the synchronicity and discrepancy of temperature variations along the Eastern margin of the Tibetan Plateau (ETP) is critical in understanding the driving forcing of regional temperature variations. In this study, we established δ15N timeseries in organic matter and δ13C timeseries in ostracod shells from sediments of Lake Lugu and attributed their variations to decadal/multi-decadal temperature variations. We compared temperature variations along the ETP transect during the past four centuries based on our presently developed and previously developed temperature proxy indices, as well as temperature variations reconstructed by other researchers. We found that: (1) Over the north ETP area (N-ETP), the decadal/multi-decadal variations in temperature correlate well with each other. (2) Over the south ETP area (S-ETP), temperature variations correlate not so well with each other; while those at south to west portion of the Tibetan Plateau are rather local. (3) The decadal variations in temperature are generally synchronous with those in precipitation over the N-ETP area, and they are broadly anti-phase/out-of-phase with the corresponding ones over the S-ETP area. (4) The long term temperature and precipitation trends are coupling over the N-ETP but decoupling over the S-ETP. We speculate that because the N-ETP is located at the frontier of the Asian summer monsoon (ASM) region, temperature variations there are not as strongly influenced by the ASM; they are most likely dominated by changes in solar activities, and show general similarity to the average of the Northern Hemisphere. Over the S-ETP area, decadal temperature variations are obviously influenced by precipitation. Because the decadal/multi-decadal precipitation variations are anti-phase and/or out-of-phase between the N-ETP and S-ETP, the decadal/multi-decadal temperature variations between these two regions are also anti-phase and/or out-of-phase.

Und noch einmal Tibetplateau. Ein Forscherteam um Xiumei Li beschrieb im Juni 2015 in The Holocene eine Klimarekonstruktion für die vergangenen 2000 Jahre mit ausgeprägter solarer Suess-de Vries 200-Jahres-Zyklizität:

Centennial-scale climate variability during the past 2000 years on the central Tibetan Plateau
It is currently suggested that climate change on the northeastern Tibetan Plateau (TP) was influenced alternately by the monsoon and the Westerlies. However, the mechanisms driving Holocene climate change on the TP remain unclear, since the extent of the influence of individual atmospheric circulation systems has not yet been clearly defined because of the shortage of high-quality paleoclimatic records. This is especially true in the central TP, where only a few ice core and paleolimnological records are available. Here, we present a decadal-resolution temperature record from Dagze Co in the central TP for the past 2000 years, based on the unsaturation index of long-chain alkenones, using an updated temperature calibration, and a record of precipitation isotopes from compound-specific isotope ratios of leaf waxes. The centennial-scale variation of the temperature and precipitation isotope records captures well-known climatic events over the past 1000 years, for example, the ‘Little Ice Age’, which was cooler and drier than the ‘Medieval Warm Period’. However, the relationship between temperature and the precipitation isotope records differed during the interval at 2000–1000 cal. yr BP compared to the past 1000 years, probably because of changes in precipitation seasonality and the additional influence of the Westerlies on the central TP. In addition, the temperature records exhibit a prominent 210-year cyclicity, suggesting a possible influence of solar radiation on temperature variability.

Gehen wir nun in den Nordwesten Chinas. Auch hier prägt der solare Suess-de Vries-Zyklus das Klima, wie Tiwari und Rajesh im Mai 2014 in den Geophysical Research Letters dokumentierten. Die Autoren präsentieren eine Rekonstruktion der Niederschläge für die vergangenen 700 Jahre, wobei das Grundwasser im Takte der Sonne schrumpfte und expandierte:

weiter lesen

Teilen:

Asiatischer Monsun in China maßgeblich durch Sonnenaktivitätsschwankungen gesteuert

Der Monsun ist für China von größter Bedeutung. Das Geesthachter Helmholtz-Zentrum schreibt hierzu auf seinem wiki Bildungsserver Klimawandel:

In vielen Monsungebieten ist die Landwirtschaft daher in hohem Maße von den sommerlichen Monsun-Niederschlägen abhängig. Auch für den Anbau in der Nachmonsunzeit (ab November auf der Nordhalbkugel) sind die vorausgegangenen Monsunniederschläge wichtig, da bei reichlichen Niederschlägen Bodenfeuchte und Grundwasserspeicher hoch sind, was den Winterpflanzen zugute kommt bzw. der Bewässerung dient. Es gibt weltweit keine Klimaschwankung, die einen größeren Einfluss auf die Gesellschaft hat, als die Veränderungen des Monsun-Niederschlags, der die Lebensader von Zweidritteln der Weltbevölkerung darstellt.Insbesondere gilt das für Indien und China mit ihren sehr hohen Bevölkerungsdichten in den Monsungebieten. Veränderungen der Monsunzirkulation durch den Klimawandel sind daher von größter Bedeutung für einen erheblichen Teil der Weltbevölkerung.

Paläoklimatologische Untersuchungen konnten eine sehr starke natürliche Variabilität des Asiatischen Monsuns dokumentieren. Es ist daher von größter Bedeutung, zunächst die natürliche Schwankungsbreite und den Antrieb der Veränderungen zu verstehen, bevor über anthropogene Einflüsse spekuliert wird. China hat dies bereits erkannt und eine ganze Reihe von Studien initiiert, die die Monsunvariabilität der letzten 10.000 Jahre zum Thema hatten. Interessanterweise finden fast alle Studien, dass die Stärke des Monsuns maßgeblich von der Sonnenaktivität beeinflusst wird.

Im Oktober 2014 veröffentlichten Yin et al. in Climate of the Past eine Arbeit auf Basis von Untersuchungen von Höhlen-Tropfsteinen aus Zentralchina. Sie fanden, dass der Monsun während extremer solarer Schwächephasen wie dem Maunder Minimum ausblieb und sich Dürren entwickelten. Auch die Temperaturen zeigten einen engen Bezug zur Sonnenaktivität. Hier der Abstract:

Variation in the Asian monsoon intensity and dry–wet conditions since the Little Ice Age in central China revealed by an aragonite stalagmite
This paper focuses on the climate variability in central China since AD 1300, involving:
(1) a well-dated, 1.5-year resolution stalagmite δ
18O record from Lianhua Cave, central China
(2) links of the δ
18O record with regional dry–wet conditions, monsoon intensity, and temperature over eastern China
(3) correlations among drought events in the Lianhua record, solar irradiation, and ENSO (El Niño–Southern Oscillation) variation.
We present a highly precise, 230Th / U-dated, 1.5-year resolution δ
18O record of an aragonite stalagmite (LHD1) collected from Lianhua Cave in the Wuling Mountain area of central China. The comparison of the δ18O record with the local instrumental record and historical documents indicates that (1) the stalagmite δ18O record reveals variations in the summer monsoon intensity and dry–wet conditions in the Wuling Mountain area. (2) A stronger East Asian summer monsoon (EASM) enhances the tropical monsoon trough controlled by ITCZ (Intertropical Convergence Zone), which produces higher spring quarter rainfall and isotopically light monsoonal moisture in the central China. (3) The summer quarter/spring quarter rainfall ratio in central China can be a potential indicator of the EASM strength: a lower ratio corresponds to stronger EASM and higher spring rainfall. The ratio changed from <1 to >1 after 1950, reflecting that the summer quarter rainfall of the study area became dominant under stronger influence of the Northwestern Pacific High. Eastern China temperatures varied with the solar activity, showing higher temperatures under stronger solar irradiation, which produced stronger summer monsoons. During Maunder, Dalton and 1900 sunspot minima, more severe drought events occurred, indicating a weakening of the summer monsoon when solar activity decreased on decadal timescales. On an interannual timescale, dry conditions in the study area prevailed under El Niño conditions, which is also supported by the spectrum analysis. Hence, our record illustrates the linkage of Asian summer monsoon precipitation to solar irradiation and ENSO: wetter conditions in the study area under stronger summer monsoon during warm periods, and vice versa. During cold periods, the Walker Circulation will shift toward the central Pacific under El Niño conditions, resulting in a further weakening of Asian summer monsoons.

Im August 2015 legte eine Forschergruppe um Dianbing Liu in den Quaternary Science Reviews nach. Die Wissenschaftler dokumentierten einen deutlichen 200-Jahreszyklus, der dem solaren Suess-de Vries-Zyklus entspricht. Liu und Kollegen postulieren eine bedeutende solare Beeinflussung des Monsungeschehens in Zentral-China. Hier der Abstract:

weiter lesen

Teilen:

Sonne macht Klima: Neues zu den solaren Millenniumszyklen aus Ostasien

Unsere Forschungsreise auf den Spuren der Sonne führt uns heute nach Ostasien. Von hier liegt eine umfangreiche Literatur zur klimatischen Wirkung solarer Aktivitätsschwankungen vor. Nahezu jede Woche kommt ein weiteres Paper hinzu. So konnte man zum Beispiel im Mai 2015 in Palaeo3 fündig werden. Eine Gruppe um Jiaping Ruan von der Universität Peking rekonstruierte im Ostchinesischen Meer mithilfe eines Sedimentbohrkerns die Meeresoberflächentemperaturen der letzten 15.000 Jahre. Dabei fällt eine ganze Serie von abrupten Abkühlungsphasen ins Auge, die jeweils 200 bis 1000 Jahre anhielten. Die meisten dieser Abkühlungsereignisse ereigneten sich interessanterweise zeitgleich mit Kaltphasen im Nordatlantik, die ein Team von Gerard …

weiter lesen

Sonne macht Klima: Neues aus Afrika

Auch in Afrika hat die Sonne in den letzten 10.000 Jahren kräftig bei der Klimagestaltung mitgemischt. Beispiel Ägypten: Im Mai 2014 erschien im Fachblatt Paleoceanography eine Studie einer Gruppe der Universitäten Utrecht und Oldenburg um Rick Hennekam. Die Forscher untersuchten die Zeit von 11.000-6.000 Jahre vor heute anhand von Mikrofossilien und anderen klimarelevanten Parametern. Dabei fanden sie, dass die Abflussmenge des Nils während dieser Zeit stark schwankte, und zwar im Takte der Sonnenaktivität. Neben den Niederschlägen und dem Wasservolumen beeinflusste die Sonne zudem auch den Sauerstoffgehalt in systematischer Weise. Hier der Abstract: Solar forcing of Nile discharge and sapropel S1 …

weiter lesen

Sonne macht Klima: Neues aus Europa

Laut den IPCC-Berichten spielen Aktivitätsschwankungen der Sonne im Klimageschehen keine große Rolle. Diese Schlussfolgerung löst jedoch Verwunderung aus, denn der Blick zurück in die Klimageschichte der letzten 10.000 Jahre zeigt eine Vielzahl von eindrucksvollen Beispielen für eine bedeutende solare Klimabeeinflussung. Es ist unwahrscheinlich, dass der Mensch diese Wechselwirkung zwischen unserem Mutterstern und dem Erdklima plötzlich aufgehoben haben soll. Ein schönes Fallbeispiel stammt aus den Quaternary Science Reviews. Ojala und Kollegen veröffentlichten dort im März 2015 eine Studie zur Klimageschichte Skandinaviens auf Basis von Seesedimentuntersuchungen. Die Wissenschaftler fanden charakteristische Zyklizitäten, darunter die bekannten solaren Eddy (1000 Jahre), Suess-de Vries (200 Jahre) und Gleissberg (90 Jahre) Zyklen:

Effects of solar forcing and North Atlantic oscillation on the climate of continental Scandinavia during the Holocene
10,000-year-long varved sediment records from lakes Nautajärvi and Korttajärvi, Finland provide evidence of climate and environment oscillations at multi-decadal to millennial timescales. We used two independent methods to extract periodic features from these time series of clastic laminae and assess their statistical reliability. Analyses revealed that seasonal sediment fluxes correspond to environmental changes with statistically significant periodicities of 1500–1800, 1000, 600–800, nearly 300, nearly 200, 150–170, nearly 90 and 47 years, showing variable coherency with different climate forcing factors and other palaeoproxy records in the Northern Hemisphere. Results indicate that the Holocene winter climate in continental Scandinavia was forced by a combination of several factors, at least by solar variability and the North Atlantic ocean–atmosphere circulation-patterns, with varying influences through time.

Insbesondere der 1000-Jahres-Zyklus tritt hervor. In der Discussion schreiben die Autoren:

“Identification of the 1000-year cycle in the NJ record suggests that solar forcing has probably effected on millennial-scale climatic and environmental fluctuations in continental Scandinavia during the Holocene.”

Auch im Bereich der Nordsee gibt es neue Hinweise auf eine solare Klimabeeinflussung. Im Juli 2014 veröffentlichte eine Forschergruppe der Universität Mainz bestehend aus Hilmar Holland, Bernd Schöne, Constanze Lipowsky und Jan Esper im Fachblatt The Holocene eine Klimastudie auf Basis von Anwachsstreifen in Muschelschalen. Dabei deckten die Wissenschaftler die vergangenen 1000 Jahre ab. Holland und Kollegen fanden, dass das Klima immer dann besonders stark schwankte, wenn die Sonnenaktivität auf Minimalwerte absank. Dies gilt insbesondere für die solaren Maunder- und Spörer-Minima während der Kleinen Eiszeit. Hier die Kurzfassung der Arbeit:

Decadal climate variability of the North Sea during the last millennium reconstructed from bivalve shells (Arctica islandica)
Uninterrupted, annually resolved paleoclimate records are crucial to contextualize the current global change. Such information is particularly relevant for the Europe realm for which weather and climate projections are still very challenging if not virtually impossible. This study presents the first precisely dated, annually resolved, multiregional Arctica islandica chronologies from the North Sea which cover the time interval ad 1040–2010 and contain important information on supra-regional climatic conditions (sea surface temperature (SST), ocean productivity, wind stress). Shell growth varied periodically on timescales of 3–8, 12–16, 28–36, 50–80, and 120–240 years, possibly indicating a close association with the North Atlantic Oscillation, ocean-internal cycles of the North Atlantic controlled by ocean–atmosphere couplings, and the Atlantic Multi-Decadal Oscillation. Increased climatic instability, that is, stronger quasi-decadal variability, seems to be linked to the predominance of atmospheric forcings and some significantly decreased insolation phases (e.g. Spörer and Maunder Minima). Increased climatic variability of shorter timescales was also observed during some particularly warm phases or regime shifts (e.g. during the ‘Medieval Climate Anomaly’ and since c. 1970). More stable climatic conditions, that is, extended warm or cold periods (‘Medieval Climate Anomaly’, ‘Little Ice Age’), however, fell together with a predominance of multi-decadal oceanic cycles. Whether the sunspot number and the higher frequency climate variability are causally linked and which processes and mechanisms are required lie beyond this study.

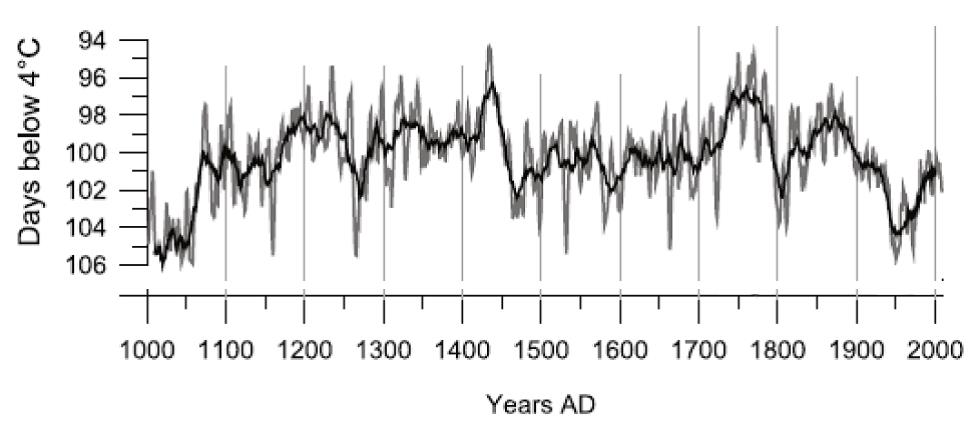
Gehen wir nun einige hundert Kilometer nach Osten, nach Polen. Ein Team um Ivan Hernández-Almeida nahm sich im Nordosten des Landes ebenfalls die Klimageschichte des letzten Jahrtausends vor. In einem Artikel, der Mitte August 2015 in den Quaternary Science Reviews erschien, berichteten die Wissenschaftler von starken natürlichen Klimaschwankungen und einer deutlichen solaren Beeinflussung. Hernández-Almeida fanden eine klare Gliederung in Mittelalterliche Wärmeperiode, Kleine Eiszeit und Moderne Wärmeperiode. Dabei fielen die Winter vor 1000 Jahren während der Mittelalterlichen Wärmeperiode sogar milder aus als heute (Abbildung 1). In den letzten 50 Jahren ist im Datensatz zudem eine Verschärfung der polnischen Winter zu erkennen. Im Folgenden die Kurzfassung der Arbeit:

A chrysophyte-based quantitative reconstruction of winter severity from varved lake sediments in NE Poland during the past millennium and its relationship to natural climate variability
Chrysophyte cysts are recognized as powerful proxies of cold-season temperatures. In this paper we use the relationship between chrysophyte assemblages and the number of days below 4 °C (DB4 °C) in the epilimnion of a lake in northern Poland to develop a transfer function and to reconstruct winter severity in Poland for the last millennium. DB4 °C is a climate variable related to the length of the winter. Multivariate ordination techniques were used to study the distribution of chrysophytes from sediment traps of 37 low-land lakes distributed along a variety of environmental and climatic gradients in northern Poland. Of all the environmental variables measured, stepwise variable selection and individual Redundancy analyses (RDA) identified DB4 °C as the most important variable for chrysophytes, explaining a portion of variance independent of variables related to water chemistry (conductivity, chlorides, K, sulfates), which were also important. A quantitative transfer function was created to estimate DB4 °C from sedimentary assemblages using partial least square regression (PLS). The two-component model (PLS-2) had a coefficient of determination of Rcross2 = 0.58, with root mean squared error of prediction (RMSEP, based on leave-one-out) of 3.41 days. The resulting transfer function was applied to an annually-varved sediment core from Lake Żabińskie, providing a new sub-decadal quantitative reconstruction of DB4 °C with high chronological accuracy for the period AD 1000–2010. During Medieval Times (AD 1180–1440) winters were generally shorter (warmer) except for a decade with very long and severe winters around AD 1260–1270 (following the AD 1258 volcanic eruption). The 16th and 17th centuries and the beginning of the 19th century experienced very long severe winters. Comparison with other European cold-season reconstructions and atmospheric indices for this region indicates that large parts of the winter variability (reconstructed DB4 °C) is due to the interplay between the oscillations of the zonal flow controlled by the North Atlantic Oscillation (NAO) and the influence of continental anticyclonic systems (Siberian High, East Atlantic/Western Russia pattern). Differences with other European records are attributed to geographic climatological differences between Poland and Western Europe (Low Countries, Alps). Striking correspondence between the combined volcanic and solar forcing and the DB4 °C reconstruction prior to the 20th century suggests that winter climate in Poland responds mostly to natural forced variability (volcanic and solar) and the influence of unforced variability is low.

Abbildung 1: Schwankungen in der Härte der polnischen Winter während der letzten 1000 Jahre. Aufgetragen ist die Anzahl der Tage mit Temperaturen unter 4°C. Ausschlag nach unten zeigte strenge Winter, Ausschlag nach oben milde Winter an. Aus: Hernández-Almeida et al. 2015.


Auf unserem europäischen Streifzug durch die aktuelle Literatur zur Klimawirkung der Sonne geht es jetzt an den Südwestzipfel des Kontinents. In Portugal untersuchte eine Forschergruppe um Santos et al. die Temperaturgeschichte der letzten 400 Jahre. Zum Wissenschaftlerteam gehört unter anderem auch Eduardo Zorita vom Helmholtz-Zentrum in Geesthacht. Im Fachblatt Climate of the Past berichten Santos und Kollegen über klare klimatische Auswirkungen der solaren Maunder und Dalton Minima auf das Temperaturgeschehen:

weiter lesen

Teilen:

Sonne macht Klima: Nachweis der solaren 90- und 200-Jahreszyklik im irdischen Klimageschehen

Die Sonnenaktivität schwankt im Rhythmus recht gut bekannter Zyklen, darunter der Gleissbergzyklus im Bereich von 90 Jahren plusminus 30 Jahre. Im März 2015 erschien im Fachblatt Advances in Space Research eine Arbeit von Orgutsov et al. die eine solare Gleissberg-Zyklik in der Dauer der Wachstumsperiode der nördlichen Hemisphäre während der vergangenen 450 Jahre entdeckte. Die Autoren vermuten eine solare Beeinflussung der Temperaturen mit Auswirkungen auf das Pflanzenwachstum. Hier der Abstract: Evidence for the Gleissberg solar cycle at the high-latitudes of the Northern Hemisphere Time evolution of growing season temperatures in the Northern Hemisphere was analyzed using both wavelet and Fourier …

weiter lesen

Sonne macht Klima: Solarer 11-Jahres-Zyklus in natürlichen Klimaarchiven nachgewiesen

Die Sonnenaktivität schwankt im Takt einer Reihe von charakteristischen Zyklen. Am bekanntesten ist der 11-jährige Schwabezyklus. Natürlich sind 11 Jahre aus klimatischer Sicht eine relativ kurze Zeit. Durch die Trägheit des Klimasystems ist hier nicht mit großen klimatischen Auswirkungen zu rechnen. Dennoch lohnt es sich hier genauer hinzuschauen. Eine Reihe von Studien hat sich in den vergangenen Jahren dem Schwabe-Zyklus angenommen und in historischen Datensätzen nach einer möglichen klimatischen Kopplung gesucht. Um es vorweg zu nehmen: Die Suche hat sich ausgezahlt: Der solare Schwabe-Zyklus hat durchaus eine messbare und nicht zu unterschätzende Klimawirkung. Beginnen möchten wir in Deutschland. Eine Forschergruppe …

weiter lesen

Was gibt es Neues von der Sonne? Eine Übersicht zu aktuellen Arbeiten im Themenkomplex Sonne-Klima

Vor mehr als drei Jahren erschien (im Februar 2012) unser Buch Die kalte Sonne. Darin beschrieben wir eine Vielzahl von wissenschaftlichen Ergebnissen, die eine signifikante Beteiligung von Sonnenaktivitätsschwankungen am Klimageschehen nahelegen. Führende deutsche Klimawissenschaftler fühlten, dass Ihr CO2-dominiertes Weltbild plötzlich in Gefahr geriet und kämpften aktiv gegen die Sonne an.

Mit etwas Abstand ist dem einen oder anderen IPCC-Klimakämpfer die überzogene Reaktion vielleicht sogar peinlich geworden. Mittlerweile wird immer klarer, dass man die klimatische Rolle der Sonne wohl lange Zeit unterschätzt hatte. Hierauf weisen auch aktuelle Studien hin, die wir in den kommenden Tagen hier im Blog zusammenfassen möchten. Was gibt es eigentlich Neues von der Sonne?

Erste Anlaufstelle zur Literaturrecherche ist die Webseite „Club de Soleil“ die vom Klimaforscher Maarten Blaauw von der Queen’s University of Belfast betrieben wird. Allein für 2015 hat Blaauw bis jetzt 23 Arbeiten vorgestellt, und ein Drittel des Jahres steht sogar noch aus. Hochaktuell sind auch zwei zusammenfassende Arbeiten von David Douglass und Robert Knox, die im April 2015 in Physics Letters A erschienen sind. Die Autoren fanden ein klares solares Signal in den Ozeantemperaturen:

Teil 1:
The Sun is the climate pacemaker I. Equatorial Pacific Ocean temperatures
Equatorial Pacific Ocean temperature time series data contain segments showing both a phase-locked annual signal and a phase-locked signal of period two years or three years, both locked to the annual solar cycle. Three such segments are observed between 1990 and 2014. It is asserted that these are caused by a solar forcing at a frequency of 1.0 cycle/yr. These periodic features are also found in global climate data (following paper). The analysis makes use of a twelve-month filter that cleanly separates seasonal effects from data. This is found to be significant for understanding the El Niño/La Niña phenomenon.

Teil 2:
The Sun is the climate pacemaker II. Global ocean temperatures
In part I, equatorial Pacific Ocean temperature index SST3.4 was found to have segments during 1990–2014 showing a phase-locked annual signal and phase-locked signals of 2- or 3-year periods. Phase locking is to an inferred solar forcing of 1.0 cycle/yr. Here the study extends to the global ocean, from surface to 700 and 2000 m. The same phase-locking phenomena are found. The El Niño/La Niña effect diffuses into the world oceans with a delay of about two months.

Siehe auch Besprechung der Arbeiten auf WUWT.

Im April 2014 wies das Blog The Hockey Schtick darauf hin, dass eine zeitliche Aufsummierung der Sonnenaktivität möglicherweise ein viel besserer Ansatz für den Vergleich mit der Temperaturentwicklung darstellt. Begründet werden kann dies durch die große Trägheit des Klimasystems. Plotten Sie es hier einmal selber. Das Ergebnis ist erstaunlich.

Interessant ist auch eine chinesische Arbeit aus dem Juni 2014 über das Science China Press die folgende Pressemitteilung herausgab:

Has solar activity influence on the Earth’s global warming?

A recent study demonstrates the existence of significant resonance cycles and high correlations between solar activity and the Earth’s averaged surface temperature during centuries. This provides a new clue to reveal the phenomenon of global warming in recent years.

Their work, entitled „Periodicities of solar activity and the surface temperature variation of the Earth and their correlations“ was published in CHINESE SCIENCE BULLETIN (In Chinese) 2014 No.14 with the co-corresponding authors of Dr. Zhao Xinhua and Dr. Feng Xueshang from State key laboratory of space weather, CSSAR/NSSC, Chinese Academy of Sciences. It adopts the wavelet analysis technique and cross correlation method to investigate the periodicities of solar activity and the Earth’s temperature as well as their correlations during the past centuries.

Global warming is one of the hottest and most debatable issues at present. The Intergovernmental Panel on Climate Change (IPCC) claimed that the release of the anthropogenic greenhouse gases contributed to 90% or even higher of the observed increase in the global average temperature in the past 50 years. However, the debate on the causes of the global warming never stops. Research shows that the current warming does not exceed the natural fluctuations of climate. The climate models of IPCC seem to underestimate the impact of natural factors on the climate change, while overstate that of human activities. Solar activity is an important ingredient of natural driving forces of climate. Therefore, it is valuable to investigate the influence of solar variability on the Earth’s climate change on long time scales.

This innovative study combines the measured data with those reconstructed to disclose the periodicities of solar activity during centuries and their correlations with the Earth’s temperature. The obtained results demonstrate that solar activity and the Earth’s temperature have significant resonance cycles, and the Earth’s temperature has periodic variations similar to those of solar activity (Figure 1). This study also implies that the „modern maximum“ of solar activity agrees well with the recent global warming of the Earth. A significant correlation between them can be found (Figure 2). As pointed out by a peer reviewer, „this work provides a possible explanation for the global warming“.

See the article:

ZHAO X H, FENG X S. Periodicities of solar activity and the surface temperature variation of the Earth and their correlations (in Chinese). Chin Sci Bull (Chin Ver), 2014, 59: 1284, doi: 10.1360/972013-1089 http://csb.scichina.com:8080/kxtb/CN/abstract/abstract514043.shtml

Science China Press Co., Ltd. (SCP) is a scientific journal publishing company of the Chinese Academy of Sciences (CAS). For 60 years, SCP takes its mission to present to the world the best achievements by Chinese scientists on various fields of natural sciences researches.

http://www.scichina.com/

Maliniemi und Kollegen beschrieben im August 2014 im Journal of Geophysical Research einen Zusammenhang der Wintertemperaturen auf der Nordhemisphäre mit dem Sonnenfleckenzyklus:

weiter lesen

Teilen:

Und sie macht es doch: Klima vermutlich stärker von der Sonnenaktivität beeinflusst als gedacht

Im Februar 2015 war es wieder so weit: IPCC-freundliche Kreise ließen per Zeitungsartikel mitteilen, dass die Sonne nichts mit dem Klimawandel zu tun habe. Da sei man sich jetzt ganz sicher. Diese unsinnige Diskussion müsse endlich ein Ende nehmen. Sämtliche Publikationen die einen solaren Klimaeinfluss fanden müssen wohl von der fossilen Brennstoffindustrie bezahlt worden sein und wären damit unbrauchbar.

Einige Leser mögen sich erinnern: Der Harvard-Forscher Willie Soon hatte es doch tatsächlich gewagt, Geld aus der Industrie anzunehmen. Dies tat er, weil staatliche Stellen lieber Geld in theoretische Modellierungsstudien stecken wollten, als in unbequeme klimahistorische Untersuchungen. Die Washington Post schrieb ihren Lesern die Kernbotschaft gleich in den Artikel-Titel:

No, the sun isn’t driving global warming
[…] Despite all the attention to who funds him, it is important to note that much of the controversy here is about Soon’s actual scientific views. While Soon has challenged the conclusions of other climate and environmental researchers on subjects ranging from the vulnerability of polar bears to the planet’s climate history, one of his principal arguments has long been that variations in the behavior of the sun, rather than human caused greenhouse gas emissions, are the central factor driving climate change. This “it’s the sun” claim is an extremely popular argument with climate change doubters according to the website Skeptical Science, it is the second most popular anti-global warming argument of them all, second only to “climate’s changed before.” So is there any truth to it? After all, regardless of who supports his research, if Soon is actually right on the substance then we may be getting all worked up about global warming for nothing.

Klimabeeinflussung der Sonne als klassisches irregeleitetes Skeptikerargument? In unserem Buch „Die kalte Sonne“ haben wir die aktuelle Literatur zum Thema zusammengefasst und überwältigende Hinweise auf eine starke Verknüpfung von Sonne und Klima gefunden. Darin kommen Arbeiten von Willie Soon vor, aber halt auch Studien hunderter anderer Wissenschaftler. Die Verschwörungstheorie einer fossil-bezahlten Wissenschafts-Fälschergruppe fällt somit schnell in sich zusammen. Mehr rhetorisch als ernstgemeint fragt die Washington Post, ob Soon vielleicht sogar Recht haben könnte. In der Folge versucht die Zeitung jedoch eifrig mit überholten Argumenten Soon und das Solarmodul zu widerlegen:

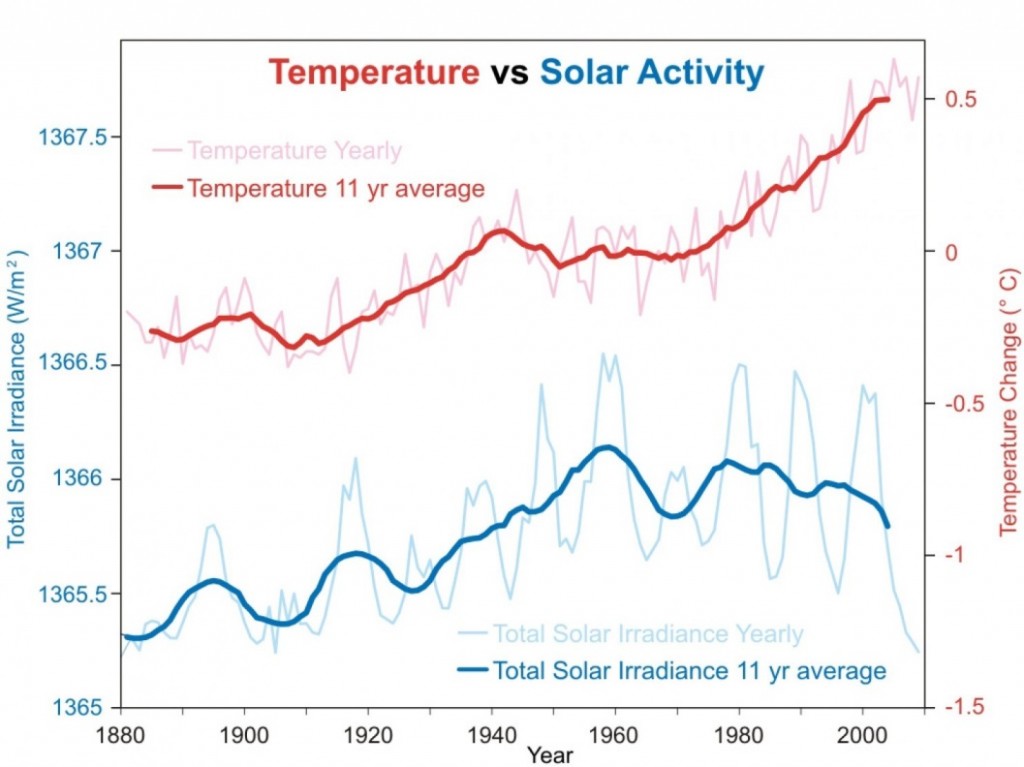
[…] However, the idea that the sun is currently driving climate change is strongly rejected by the world’s leading authority on climate science, the U.N.’s Intergovernmental Panel on Climate Change, which found in its latest (2013) report that “There is high confidence that changes in total solar irradiance have not contributed to the increase in global mean surface temperature over the period 1986 to 2008, based on direct satellite measurements of total solar irradiance.” The IPCC “basically says that global warming is not caused by the sun,” says Gerald Meehl, a senior scientist at the National Center for Atmospheric Research. “The strongest evidence for this is the record of satellite measurements of solar output since the late 1970s that show no increasing trend in solar output during a period of rapid global warming.” Here’s a graphic, courtesy of Skeptical Science, showing overall trends in solar irradiance and temperature:


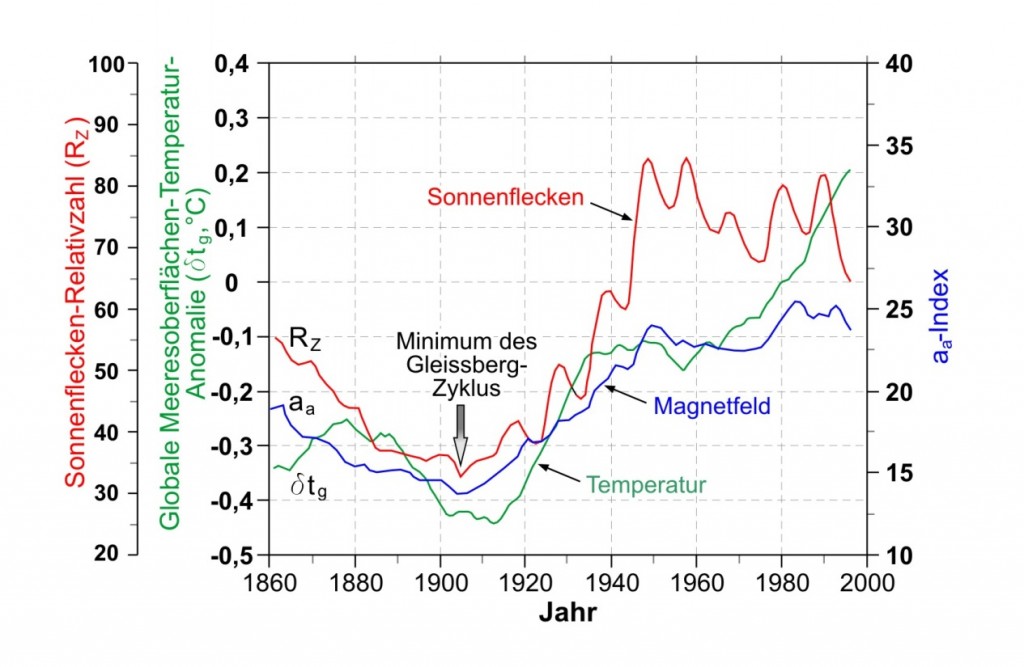
Eine tolle falsche Fährte: Die Sonne erreichte in der zweiten Hälfte des 20. Jahrhunderts eine der stärksten Aktivitäten der letzten 10.000 Jahre, und die Argumentation konzentriert sich auf die letzten 30 Jahren, von denen 17 gar keine Erwärmung zeigen. Zudem geht es wohl gar nicht um die „Total Solar Irradiance“ (TSI), sondern vielmehr um mit der Sonnenaktivität gekoppelte Magnetfelder, die ihre stärkste Phase 1980-2000 erreichten (Abbildung 1).

Abbildung 1: Entwicklung der Sonnenaktivität während der letzten 150 Jahre am Beispiel der Sonnenflecken und des Sonnenmagnetfeldes (nach Mufti & Shah 2011).


Die Washington Post weiter:

[…] It isn’t only the IPCC that concludes this. “No satellite measurements have indicated that solar output and variability have contributed in a significant way to the increase in global mean temperature in the past 50 years,” concluded a recent workshop report from the National Academy of Sciences. The report noted that while the 11-year sunspot cycle can lead to changes in total solar irradiance of as much as .1 percent, that only translates into a “few hundredths of a degree centigrade” temperature response on the Earth. “Clearly the sun matters and if it varied a lot then there would be consequences, but it doesn’t,” explains Kevin Trenberth, a prominent climate researcher who is also at the National Center for Atmospheric Research. “The variations are only order 0.1%.” Of particular significance is the fact that solar irradiance has not shown an increasing trend over the past several decades, while global temperatures clearly have.

Ein wirklich unsinniges Argument. Hier wird vergessen, dass es Jahrzehnte dauern kann, bis sich das träge Klimasystem an eine höhere Sonnenaktivität anpassen kann. Analog Kochherd: Eine konstant hohe Flamme schafft es ja auch, einen Topf Wasser stetig zu erwärmen, bis die jeweilige Gleichgewichtstemperatur erreicht ist.

Sichtlich zufrieden mit ihrer Pseudoargumentation schlussfolgert die Washington Post:

So in sum: It’s not that the sun can’t influence climate. It can, and it does. And climate scientists have accordingly been studying the influence of the sun for many years. And they have found that, while the sun certainly is not irrelevant, the case for steadily rising carbon dioxide as the principal factor driving the current warming trend just makes a lot more sense. Willie Soon and some other climate change doubters would surely argue back against this finding — but it’s a strong consensus finding, as shown above. The weight of expert opinion isn’t with these doubters — but the burden of proof most definitely is.

Hier liegt die Washington Post einmal richtig: Es gab in der Tat ein Vielzahl von Studien zum Thema Sonne-Klima. Allerdings fanden sie etwas ganz anderes, nämlich eine starke klimatische Beeinflussung. Der IPCC hat diesen wichtigen empirischen Befund in seinen Formeln einfach ignoriert und lässt mit einem verschwindend geringen „Strahlungsantrieb“ von solaren Schwankungen rechnen, also einer minimalen Klimawirksamkeit der Sonne. Der Hinweis der Washington Post auf die IPCC-Ergebnisse ist daher eher kontraproduktiv, da die IPCC-Sichtweise die realen Daten nicht erklären kann.

Natürlich besitzen die IPCC-Kreise auch in Deutschland die Pressehoheit. Daher wundert es kaum, dass auch hier die Sonne kleingeschrieben wird. So geschehen am 10. August 2015 auf Sinexx:

Klimawandel: Doch kein Einfluss der Sonnenaktivität?
Vermeintlicher Anstieg entpuppt sich als Methodikfehler bei der Sonnenfleckenzählung.
Die Sonnenaktivität hat weniger Einfluss auf die aktuelle Klimaerwärmung als angenommen. Denn ausgerechnet die Zeitreihe der Sonnenaktivität, die für einen Anstieg sprach, enthielt offenbar methodische Fehler, wie die Internationale Astronomische Union (IAU) berichtet. Nach einer Neukalibrierung der Methode geben nun historische Sonnenflecken-Beobachtungen keinerlei Hinweis mehr auf einen signifikanten Anstieg der solaren Aktivität seit Beginn der Industrialisierung.

Wir hatten an dieser Stelle bereits über die geänderte Sonnenfleckenzählung berichtet. Unser Fazit:

weiter lesen

Teilen:

Einfluss von solaren Schwankungen auf irdische Lebewelt stärker als gedacht: Princeton University findet Zusammenhang zwischen Rheuma-Leiden und Sonnenaktivität

Das Princeton Plasma Physics Laboratory (PPPL) gab am 15. Juni 2015 per Pressemitteilung eine spannende Entdeckung bekannt. Man hatte einen empirischen Zusammenhang zwischen Sonnenaktivität und der Häufigkeit von Rheuma und Arthritis entdeckt. Pia Heinemann griff das Thema zwei Wochen später in der Welt auf:

Können Sonnenflecken Krankheiten auslösen?
Ist eine erhöhte Sonnenaktivität daran schuld, wenn Menschen auf der Erde Rheuma bekommen? Ein Astrophysiker hat da einen Zusammenhang entdeckt. Das klingt skurril, lässt sich aber schwer widerlegen.
Simon Wing ist Astrophysiker, Forschungsbereich: Sonnenaktivität. Seine Frau, Lisa Rider, ist Rheumaspezialistin. Keiner versteht, was der andere gerade erforscht. Es interessierte sie bis vor wenigen Jahren auch nicht besonders. „Deshalb reden wir eigentlich nur wenig über unsere Arbeit“, sagt Wing, der an der John Hopkins University arbeitet. Doch im Jahr 2012 machte Lisa Rider eine Bemerkung, die ihn aufhorchen ließ. „Lisa erzählte mir von einer wissenschaftlichen Veröffentlichung, in der eine sehr ungewöhnliche Periodizität beschrieben wurde.“ Alle zehn Jahre kommt es demnach zu einer Häufung von rheumatoider Arthritis, also von Gelenkentzündungen. Alle zehn Jahre? Wing hatte plötzlich eine Idee. Einen solchen Rhythmus kennt jeder Astrophysiker: Alle zehn bis 13 Jahre gibt es besonders viele Flecken auf der Sonne. Diese von der Erde aus sichtbaren dunklen Stellen zeigen, dass die Sonne gerade sehr aktiv ist. Der Zyklus führt dazu, dass in periodischen Abständen mal besonders viel, mal etwas weniger ionisierende Strahlung von der Sonne auf der Erde ankommt.

Weiterlesen auf welt.de.

Im Folgenden die Pressemitteilung des Princeton Plasma Physics Laboratory in Vollversion:

Researchers correlate incidences of rheumatoid arthritis and giant cell arteritis with solar cycles

What began as a chat between husband and wife has evolved into an intriguing scientific discovery. The results, published in May in BMJ (formerly British Medical Journal) Open, show a “highly significant” correlation between periodic solar storms and incidences of rheumatoid arthritis (RA) and giant cell arteritis (GCA), two potentially debilitating autoimmune diseases. The findings by a rare collaboration of physicists and medical researchers suggest a relationship between the solar outbursts and the incidence of these diseases that could lead to preventive measures if a causal link can be established.

RA and GCA are autoimmune conditions in which the body mistakenly attacks its own organs and tissues.  RA inflames and swells joints and can cause crippling damage if left untreated. In GCA, the autoimmune disease results in inflammation of the wall of arteries, leading to headaches, jaw pain, vision problems and even blindness in severe cases.

Inspiring this study were conversations between Simon Wing, a Johns Hopkins University physicist and first author of the paper, and his wife, Lisa Rider, deputy unit chief of the Environmental Autoimmunity Group at the National Institute of Environmental Health Sciences in the National Institutes of Health, and a coauthor.  Rider spotted data from the Mayo Clinic in Rochester, Minnesota, showing that cases of RA and GCA followed close to 10-year cycles. “That got me curious,” Wing recalled. “Only a few things in nature have a periodicity of about 10-11 years and the solar cycle is one of them.”

„More than a coincidental connection“

weiter lesen

Teilen:

Die Sonne im Juni 2015: Neues Maunder-Minimum angekündigt. Droht eine Neuauflage der Kleinen Eiszeit?

Von Frank Bosse und Fritz Vahrenholt Ab dem 1. Juli 2015 zählt man offiziell die Sonnenflecken anders als bis zu diesem Monat. Aufgrund einer Arbeit eines Teams um Frédéric Clette und Leif Svalgaard und einer ganzen Reihe von internationalen Workshops zum Thema wurde die Version 2.0 der SSN (SunSpotNumber) – Erfassung veröffentlicht. Die alte (auch von uns verwendete) Reihe erhielt die Versionsnummer 1.0 und wird seit Juni 2015 nicht mehr aktuell erhoben. Sie steht als Vergleich jedoch archiviert zur Verfügung. Wir hatten ja nach Konsultation des Mitautoren Leif Svalgaard bereits in die „alte“ Version korrigierend eingegriffen, indem wir bei Vergleichen …

weiter lesen

Neue Studie im Fachblatt Geology findet engen Zusammenhang zwischen Temperaturentwicklung und Sonnenaktivität während der letzten 4000 Jahre im Nordatlantik

Im Jahre 2001 veröffentlichte der US-amerikanische Klimaforscher Gerard Bond zusammen mit Kollegen im Fachblatt Science eine Arbeit, deren Bedeutung lange unterschätzt wurde. Die Wissenschaftler hatten Sedimentkerne aus dem Nordatlantik analysiert und herausgefunden, dass sich das Klima während der vergangenen 10.000 Jahre zyklisch im Millenniumstakt verändert hat. Hierzu gehört auch die Zykik der Römischen, Mittelalterlichen und Modernen Wärmephasen. Als Antrieb der Klimaschwankungen identifizierte die Bond-Gruppe solare Aktivitätsschwankungen. In unserem Buch „Die kalte Sonne“ sind wir ausführlich auf die Entdeckung eingegangen.

Natürlich passte Anhängern der menschengemachten Klimakatastrophe dieses Modell überhaupt nicht. Leider verstarb Gerard Bond viel zu früh 2005, so dass seine Forschungen ein jähes Ende nahmen. Lange wurde die Science-Studie ignoriert. Feinde der solar-bedingten Klimavariabilität versuchten zwischenzeitlich sogar, die Ergebnisse von Bond anzuzweifeln. Allerdings fanden andere Forscher eine Vielzahl von ähnlichen Fallbeispielen aus den unterschiedlichsten Teilen der Erde, bei denen die Sonne den Millenniums-Takt für die Klimarhythmik angab.

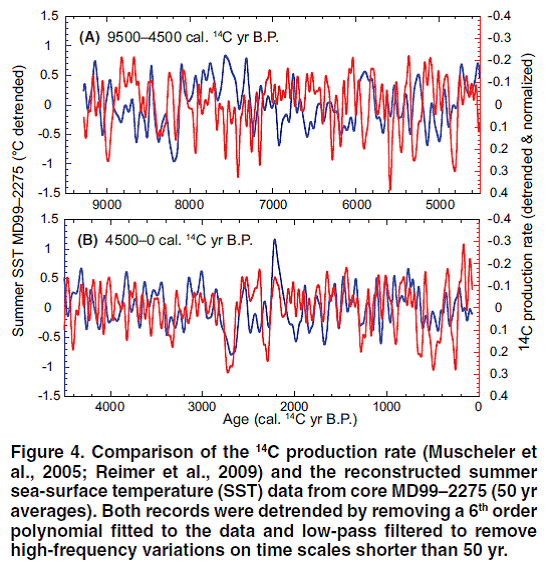
In der Februar-2015-Ausgabe des angesehenen Fachblatts Geology erschien nun eine Studie, die das Bond-Resultat von 2001 weitgehend bestätigt. Eine internationale Forschergruppe um Hui Jiang vom State Key Laboratory of Estuarine and Coastal Research in Shanghai rekonstruierte mithilfe Kieselalgen aus einem Tiefseebohrkern nördlich von Island die Temperaturentwicklung der vergangenen 9300 Jahre. Dabei fanden sie eine enge Beziehung zwischen den Klimaschwankungen und der Sonnenaktivität, insbesondere für die letzten 4000 Jahre. Maßgeblich beteiligt an der Studie war auch Raimund Muscheler von der schwedischen Lund Universität, der bereits zum Bond-Team der Publikation von 2001 zählte.

Im Folgenden die Kurzfassung der Arbeit:

Solar forcing of Holocene summer sea-surface temperatures in the northern North Atlantic
Mounting evidence from proxy records suggests that variations in solar activity have played a significant role in triggering past climate changes. However, the mechanisms for sun-climate links remain a topic of debate. Here we present a high-resolution summer sea-surface temperature (SST) record covering the past 9300 yr from a site located at the present-day boundary between polar and Atlantic surface-water masses. The record is age constrained via the identification of 15 independently dated tephra markers from terrestrial archives, circumventing marine reservoir age variability problems. Our results indicate a close link between solar activity and SSTs in the northern North Atlantic during the past 4000 yr; they suggest that the climate system in this area is more susceptible to the influence of solar variations during cool periods with less vigorous ocean circulation. Furthermore, the high-resolution SST record indicates that climate in the North Atlantic regions follows solar activity variations on multidecadal to centennial time scales.


Abbildung 1: Vergleich zwischen Temperaturschwankungen des untersuchten isländischen Kerns (blau) und der Sonnenaktivität (rot). Insbesondere für die letzten 4000 Jahre ist eine gute Korrelation erkennbar. Abbildung aus Jiang et al. 2015.

————————–

Die Universität Aarhus gab zum Paper am 27. Februar 2015  die folgende Pressemitteilung heraus:

The sun has more impact on the climate in cool periods

weiter lesen

Teilen:

Geomar: Die Sonne steuerte das Klima in der Eiszeit

Die Sonne wars. Pressemitteilung des Geomar vom 4. September 2014:

————————————-

DIE SONNE STEUERTE DAS KLIMA IN DER EISZEIT

Unregelmäßigkeiten der Sonnenaktivität beeinflussten vor 20.000 Jahren das Klima

04.09.2014/Kiel. In einer Modellstudie rekonstruierten Klimaforscher des GEOMAR Helmholtz-Zentrum für Ozeanforschung Kiel das Verhältnis zwischen Sonnenaktivität und Klima während der letzten Eiszeit. Sie konnten mit ihrem Klima-Chemie-Modell einen wesentlichen Beitrag zu einer Studie der schwedischen Lund University leisten, die jetzt in der internationalen Fachzeitschrift Nature Geoscience publiziert wurde.

Ein bekanntes Verhaltensmuster der Sonne ist ihre unregelmäßige Sonnenaktivität. Der bekannteste Aktivitätszyklus der Sonne ist der elfjährige Sonnenfleckenzyklus, bei dem sich alle elf Jahre Sonnenfleckenmaxima und -minima abwechseln. Es sind aber auch Schwankungen auf anderen Zeitskalen bekannt. Sonnenflecken sind Stellen auf der Oberfläche der Sonne, die dunkler erscheinen, weil sie Sonnenstrahlen mit  verminderter Leuchtkraft ins Universum abgeben. Gleichzeitig verlässt dort sehr energiereiche Strahlung, vor allem im UV-Bereich, die Sonne. Während des Sonnenfleckenminimums gibt es weniger Sonnenflecken und es kommt daher weniger energiereiche Sonnenstrahlung auf der Erde an, bei einem Sonnenfleckenmaximum ist es genau umgekehrt.

Mehr Sonnenstrahlung, insbesondere im UV-Bereich, führt im Sonnenfleckenmaximum zu einer Erwärmung der Stratosphäre (zwischen 15 und 50 km) in den Tropen und zu einer verstärkten Ozonproduktion. Dies führt wiederum über komplizierte Wechselwirkungsmechanismen zu Zirkulationsänderungen in der Atmosphäre, die bis zum Erdboden zu spüren sind. Die Mechanismen, wie Änderungen in der Sonnenaktivität die Atmosphäre beeinflussen, sind allerdings immer noch Gegenstand aktueller Forschung. Insbesondere wird über den Zusammenhang von großen Sonnenfleckenminima mit kalten, schneereichen Wintern spekuliert oder ob die momentan geringere Sonnenaktivität für die Pause in der globalen Erderwärmung verantwortlich sein könnte.

Wissenschaftlern der Universität Lund (Schweden) ist es jetzt in Kooperation mit den GEOMAR-Klimaforschern Prof. Dr. Katja Matthes und Dr. Rémi Thiéblemont gelungen, die Sonnenaktivität bis zur letzten Eiszeit zu rekonstruieren. Die Studie wurde im August in der internationalen Fachzeitschrift Nature Geoscience veröffentlicht.

weiter lesen

Teilen: